Indexing files in Elasticsearch

At work, I’m mentoring an computer science intern. One of the tasks I’m working on is to enumerate all of the Windows CIFS/SMB shares with weak permissions and characterize the data contained in them. Sort of a poor man’s DLP. Working with the intern, we have a Bash script written my me that does a masscan looking for ports 135/445 open, and attempts to enumerate shares using a generic account and nmap’s smb-enum module.

Once enumeration is done, the script does some mangling of the output and creates a list of //<ipaddress>/<sharename>, one share per line. A Python script them does an os.walk of the share and recursively grabs all the filenames it can. These ip address, shares, paths, and filenames are then stored in a MySQL database (in 3NF no less!) and can be queries so we can get a rough idea, based on filenames, of what kind of data we are looking at.

A good start, but really lacks contextual data. Of course, this is version .99BETA and we actually got some interesting hits, enough for management to let us continue the work. The number of files we saw were in the millions and would take an extremely long time for a single-threaded Python script running on an old, beat up workstation to process, so we’re moving on up. I figure the MySQL database is OK for right now, but if we start looking at data contents… well, we’re going to need Big Daddy Data. This looks like a job for Elasticsearch!

ES has a plugin called ingest-attachment that will index attachments. This is based on Apache Tika, which is pretty nifty for extracting data from all kinds of file formats. The files must be Base64 encoded when being uploaded to Elastic. First, stop Elastic:

service elasticsearch stop

Next install the ingest-attachment plugin:

/usr/share/elasticsearch/bin/elasticsearch-plugin install ingest-attachment

Restart Elasticsearch

systemctl start elasticsearch

Now we need a to create a pipeline in Elastic so that the data coming in is send to ingest-attachment. This definition will create a pipeline of an arbitrary name, which for this example we’ll call ‘mcboatface’, and a field called ‘data’ in which the base64 string will be stored.

curl -X PUT -H "Content-Type: application/json" "localhost:9200/_ingest/pipeline/mcboatface" -d'
  {
    "description":"Extract attachment information",
    "processors":[
      {
       "attachment":{
         "field":"data",
         "indexed_chars":-1
        }
      }
    ]
  }'

Now that the pipeline is created, we need a small sample file file to play with

[root@localhost tmp]# echo "Lorum ipsum blah blah blah" > test.txt
[root@localhost tmp]# base64 test.txt
TG9ydW0gaXBzdW0gYmxhaCBibGFoIGJsYWgK

Now we upload the Base64 string into an index called “test”, invoking the mcboatface pipeline so the data gets decoded and indexed. The string gets PUT into the data field of the index, we also must supply a ID# for the attachment, which will be 1.

curl -X PUT -H "Content-Type: application/json" "localhost:9200/test/_doc/1?pipeline=mcboatface" -d'
{
 "data":"TG9ydW0gaXBzdW0gYmxhaCBibGFoIGJsYWgK"
}'

Now we can write a query for the document. The trick here is that we are querying against the “attachment.content” field, which may not be obvious for beginning Elasticsearchers.

curl -X GET -H "Content-Type: application/json" "localhost:9200/test/_search?pretty" -d'
       { "query":{
         "match":{"attachment.content":"blah"}
        }
      }'
      
{
  "took" : 1,
  "timed_out" : false,
  "_shards" : {
    "total" : 1,
    "successful" : 1,
    "skipped" : 0,
    "failed" : 0
  },
  "hits" : {
    "total" : {
      "value" : 1,
      "relation" : "eq"
    },
    "max_score" : 0.45207188,
    "hits" : [
      {
        "_index" : "test",
        "_type" : "_doc",
        "_id" : "1",
        "_score" : 0.45207188,
        "_source" : {
          "data" : "TG9ydW0gaXBzdW0gYmxhaCBibGFoIGJsYWgK",
          "attachment" : {
            "content_type" : "text/plain; charset=ISO-8859-1",
            "language" : "is",
            "content" : "Lorum ipsum blah blah blah",
            "content_length" : 28
          }
        }
      }
    ]
  }
}

So that’s all pretty cool and stuff, but what about for bigger documents? I ran into two problems really fast- base64 by default will put in line breaks at 76 columns, and \n is not a legal base64 char. Trust me on this. Second is that Curl doesn’t like really long strings to be passed as an argument and will complain. So, goven these two things, first b64 encode the PDF without line breaks:

base64 -w 0 Google_searching.pdf > test.json

Now you’ll have to do a little preformatting by editing the test.json file and making it look like JSON data:

{"data":"JVBERi0xLjUNCiW1tbW1DQox...
<lots of base64 data here>
...o2ODI0MTANCiUlRU9G"}

Now we can use Curl’s “-d @<filename>” option to tell it to POST the data in the file. Since it’s preforrmated JSON data, it should just slide right in

curl -X PUT -H "Content-Type: application/json" "localhost:9200/test/_doc/2?pipeline=attachment&pretty" -d @test.json

{
  "_index" : "test",
  "_type" : "_doc",
  "_id" : "2",
  "_version" : 1,
  "result" : "created",
  "_shards" : {
    "total" : 2,
    "successful" : 1,
    "failed" : 0
  },
  "_seq_no" : 1,
  "_primary_term" : 1
}

And is now searchable

 curl -H "Content-Type: application/json" "localhost:9200/test/_search?pretty" -d'
{
 "query":{
  "match":{"attachment.content":"Firefox"}
 }
}'
{
  "took" : 1219,
  "timed_out" : false,
  "_shards" : {
    "total" : 1,
    "successful" : 1,
    "skipped" : 0,
    "failed" : 0
  },
  "hits" : {
    "total" : {
      "value" : 1,
      "relation" : "eq"
    },
    "max_score" : 0.5022252,
    "hits" : [
      {
        "_index" : "test",
        "_type" : "_doc",
        "_id" : "2",
        "_score" : 0.5022252,
        "_source" : {
          "data" : "JVBERi0xLjU
<lots of output>
 "attachment" : {
            "date" : "2015-11-03T02:06:29Z",
            "content_type" : "application/pdf",
            "author" : "Kate",
            "language" : "en",
            "content" : "Searching Google: tips & tricks \n\n \n\n \n\nhttp://www.google.co.nz/ \n\nSearching Google  \nThis guide covers selected tips and tricks to refine your search technique – for more \n\ninformation, consult Google’s various help screens.   \n\nPlease note: \n\n The tips and tricks described on this guide are subject to change. \n\n Google can personalise search results.  Your search results may be different from \n\nsomeone else’s and may vary according to the computer you are using. \n\n This guide is based on the Chrome browser -  Firefox

And that’s basically it!

Splunk search basics (with real-life examples)

So you’ve built your lab, created a VM, and installed the Splunk package and you’re ready to start Finding Evil but you don’t know how? Never fear.

Let’s go over some Splunk basics. When data is indexed in Splunk, there are some basic default fields that are extracted: index, timestamp, sourcetype, and host. Using these fields in your search queries will greatly speed up your searches as Splunk uses this metadata to determine which datasets it needs to look through. It’s better to use as many of these fields as you can, but the two best fields to use if you can’t use all 4 are the index and time fields.

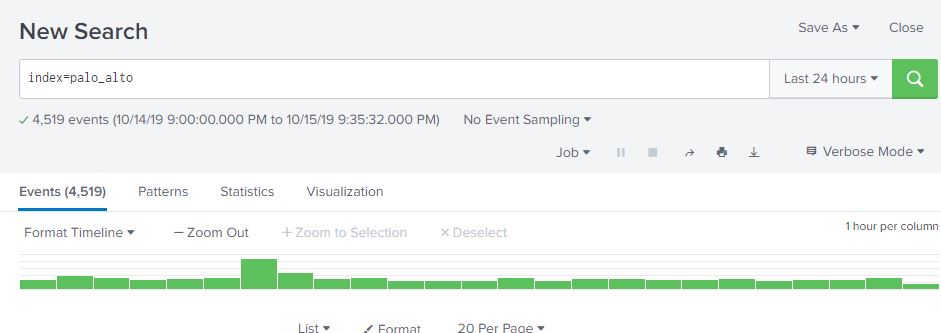
So let’s say you have your Palo Alto firewall syslogging traffic violations to your Splunk box, and you have Splunk set up to index that data into an index called “palo_alto”. Maybe you will call it “firewall”, it doesn’t matter all that much. I do like to keep similar logs together, but I have only one Palo Alto right now, so it goes into its own index. To specify which index to search, you specify on the search bar index=palo_alto

Splunk’s time picker defaults to the last 24 hours. This can be changed by either picking a new time range on the picker, or specifying an earliest and/or latest parameter in the search bar. For example, if we wanted to search for events in the palo_alto index going back 1 week, we can either select “Last 7 days” in the time picker, or add earliest=-1w (or -7d works as well). Making sure you are using the right time range is absolutely critical for getting relevant data from your searches, and for making them as efficient as possible. You may have the data, but it’s useless if it takes Splunk forever to return results!

From what we can see here, there are over 93,000 events my firewall logged over the past week, and looks like there was a big jump in the middle of the week. This is interesting, let’s dig into this and see what’s going on. From here we can highlight the time range we are interested in by selecting the time range on the timeline that contains our spike in traffic. The event count drops from 93,488 to 71,257. This is a pretty significant jump in traffic!

Is this a single IP address scanning me, or several? If you have the CIM module installed in Splunk (highly recommended), this will make life a lot easier as it will perform extractions on your data and use standardized field names that you can search on regardless of what platform generated the data. For example, my Palo Alto doesn’t even label the fields in the log, it’s sent via syslog as a long comma separated string. The CIM module will apply standard fieldnames for these values such as dest_ip, dest_port, src_ip and src_port. Another platorm may log with fieldnames like dst_address, dst_port, s_addr and s_prt. The CIM module will add the standardized fieldnames at search time so you only have to worry about src_ip and src_port and not having to remember 20 different logging formats.

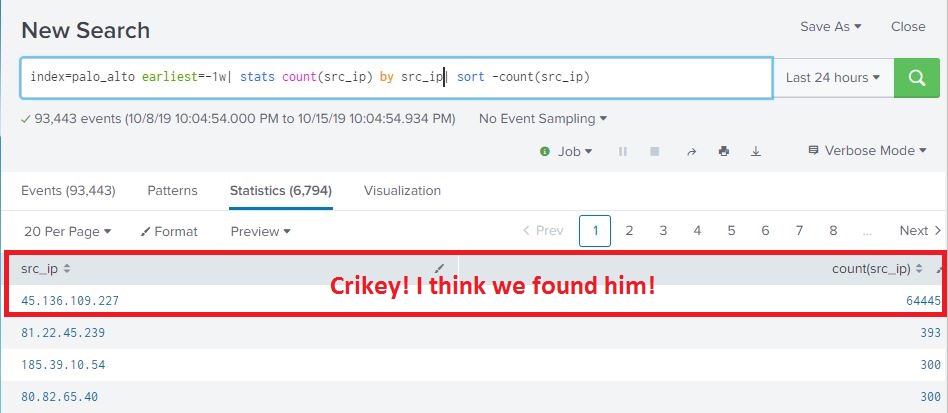
So… using standardized field names, let’s see if this is the work of one address or multiple scanners. One way we can do that is do a count for each IP address seen in this time range. If it’s a single address, we’re going to see a pretty high count. Building on our existing search and selected timerange from the timeline, we will send our 71,000 events and pipe them to the stats command. We want the count the number of times each source IP address appears in the log, so we will use the |stats count(src_ip) parameter. That’s pipe in front of the stats command, we are piping the output of the original search to this command much like we pipe the output of a Linux CLI command to another command. But we also want the source IP address to appear in the results along with the count, so we use |stats count(src_ip) by src_ip. This command will return a two column table with src_ip as one column with the source IP address, and count(src_ip) which is the count for that IP address. The command gives us a count starting from least to most, but we want to see most to least, so we need to SORT the results descending. In Splunk, we do this by piping the results of the previous command (the stats count) to the sort command and tell it to sort ascending(+) or descending(-) and which field to sort on. Since we are only returning src_ip and count(src_ip), we want to sort on the count. The command is |sort -count(src_ip)

The entire command to search is:

index=palo_alto earliest=-1w| stats count(src_ip) by src_ip|sort -count(src_ip)

Which results in:

So during the selected time, we have one IP address that is responsible for 64445 log events from my firewall. The next highest address is only 393 for the same time period, so I think we found our guy. So now that we have our offender, we can go off and so all our cyber threat intelligence and analysis and do WHOIS lookups, maybe query a few threat feeds, etc… I’ll cut to the end- this address is associated with ciarmy aka CINS Army, etc…

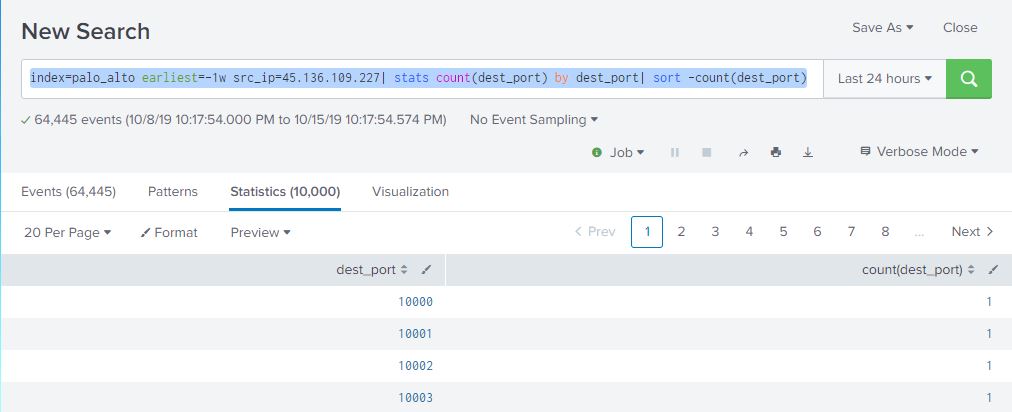
But is our Russian friend just portscanning or is he looking for something in particular? Let’s do some Splunking to see if he’s hitting the same ports over and over, it if he’s doing a 1-and-done portscan. And since we have an IP address to pivot on, we’re going to use that in our search to narrow the results down a bit. What we’re looking for is src_ip=45.136.109.227 and count, by port, of every port that this guy hit. We also want to go from highest count to lowest count, so we’re going to sort again:

index=palo_alto earliest=-1w src_ip=45.136.109.227| stats count(dest_port) by dest_port| sort -count(dest_port)

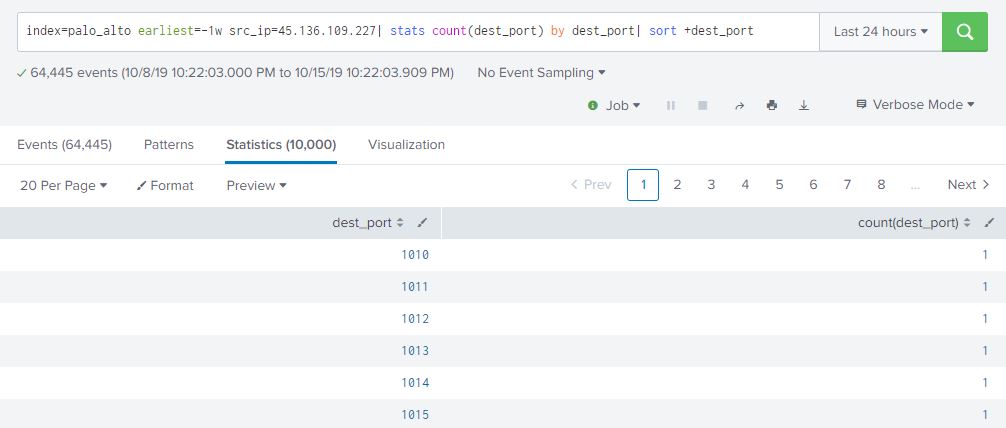
We’re seeing one hit per port, and it looks like it’s a sequential portscan. Let’s see if he was looking for any privileged ports such as ssh, telnet, etc… so instead of sorting descending by count, we’re going to sort ascending by dest_port.

index=palo_alto earliest=-1w src_ip=45.136.109.227| stats count(dest_port) by dest_port| sort +dest_port

Our Russian pal started at port 1010 and ended (if you scroll through all the results or re-run the query and sort descending by dest_port) at port 65500. Sort of interesting that he started at 1010 instead of 1025 and ended at 65500 instead of 65535. Maybe something to add to our threat intel base for TTPs….

New home lab

Doing a hardware refresh on the home network. Luckily, work assigned me a Palo Alto PA-220 to play with, which I got certified as an Admin in a week. Next, I refreshed my virtualization hardware as KVM stopped running on my older boxes a while ago, and I had been running VMs on my gaming rig as a temporary solution. My virts are taking up too much space and it’s starting to get crowded on my PC’s SSD.

So what did I do? Well, I wanted something quiet as the sound of cooling fans running eventually drives the hardiest of us slightly batty. I wanted something that sips power so I can leave the virts running 24/7. After doing a lot of research, I found that a lot of home labbers are using Intel NUCs to run ESXi. Basically, a NUC is a powerhouse computer in a teeny tiny little package. They’re passively cooled, and use little power. The more recent NUCs also run ESXi out of the box. So all I needed to do was decide which hardware platform to get, add in 32Gb of SODIMMs, and a 1Tb M2 card for storage.

Here is the BOM, and the relevant Amazon links:

  • Intel NUC – I chose the NUC8i7HNK as it has a 4-core i7 processor and runs ESXi 6.x out of the box, no updates required or customizing the ESXi installed. Also has 2 gig Ethernet interfaces, so if I start expanding, I can have a dedicated interface for management and storage. Plus the chassis has a glowing skull that you can change the color of in the BIOS, which is metal.
  • 32 Gb DDR4 SODIMMs – Intel states that the NUCs top out at 32Gb of RAM but this model and just about all the newer ones actually support 64Gb. But 32Gb SODIMMS are still pricey as the NUCs can only accept 2 banks, so I’m running 32Gb for now
  • 1Tb M2 SSD – Internal storage for the ESXi host.

Total cost is about $1k and Amazon can get everything to your mailbox in a couple of days

Installation of the memory and storage is fairly straightforward. Unscrew the six screws holding down the lid with the included Allen key. Remove lid. Disconnect the skull display, and carefully unscrew the screw holding down the chassis cover. I say carefully as this screw has a small Phillips head and Intel used blue Loc-Tite. The screw head strips easily, so make sure you have a screwdriver that fits well. After that’s it’s just slap in the memory and the M2 card. I dig Corsair memory, but did remove the stickers from the SODIMMs as I figured they may interfere with cooling. There’s a post and screw to secure the M2 card to the board, and an additional standoff and screw if you’re using the smaller sized M2. After that, it’s get everything back together and you’re ready to start installing.

The packaging is kind of cool, but I’d gladly go with a less exciting box if it means saving a few dollars. These are supposed to be gaming computers and relatively high-end HTC/media servers.

So now just download the ESXi ISO from VMware, and use Rufus to create a bootable USB key. Plug it in, power up and in about 15 minutes, you’ll have a brand new VMware host running.

New host

Move the site to a new hosting company after… what? 20 years or so? The old provider downed my site a couple of days ago and were completely unresponsive to support requests, so I voted with my wallet.

Anyway, I will be updating this site a lot more frequently. I have some plans for some interesting content, I just need to order some new lab hardware. Stay tuned…